发布时间:2026-07-28 | 来源:管理决策与信息系统重点实验室
The Global Methane Pledge faces significant challenges due to the ambiguous attribution of methane emissions within complex global supply chains and the uncertain costs of mitigation technologies. To address this knowledge gap, the paper developed a multi-regional input-output model based on environmental expansion, reflecting global production and consumption networks annually during 2000-2020, covering 76 major economies and their 14 sectors. It innovatively proposed an Environmental Double Filtering Method (EDFM), which identified the key pathways of global methane emissions, and systematically estimated the emission reduction potential with feasible technologies and the lowest cost for achieving the goals of the “Global Methane Pledge”. It distinguished the methane emissions into those embedded in domestic intermediate input (DOE) and versus those in imported intermediate inputs (IME). The results reveal a highly concentrated emission structure: just 0.24% of all network linkages account for approximately 60% of global anthropogenic methane emissions. To achieve the 2030 targets, the aggregated potential reduction in optimistic case for DOE across key linkages are projected to reach 71600 kt with a cost of US$20.4 billion, for IME are projected to 4200 kt at a cost of US$0.3 billion. The analysis identifies distinct geographic and sectoral hotspots; cost burdens are primarily concentrated in Agricultural DOE (China, Brazil, Pakistan and Bangladesh) and Waste DOE (Russia, India and China), whereas significant negative abatement costs (profitable reductions) are found in Primary Energy IME (Indonesia, Saudi Arabia, Canada, the United States, and Mexico). Notably, specific technological interventions, such as Alternate Wetting and Drying, manure storage covers in Chinese and Brazilian agriculture, demonstrate high feasibility. The research provides a systematic and quantitative approach for global methane reduction. These findings give a strategic roadmap for international collaboration, highlighting that focusing on a minimal set of high-impact pathways can lead to significant progress toward the Global Methane Pledge.
Publication:
JOURNAL OF CLEANER PRODUCTION
Article:148985
Volume: 573
Year: 2026
https://doi.org/10.1016/j.jclepro.2026.148985.
Authors:
Xiuli Liu (Corresponding author, Email: xiuli.liu@amss.ac.cn)
State Key Laboratory of Mathematical Science, Academy of Mathematics and Systems Science, Chinese Academy of Sciences,
Beijing, China
University of Chinese Academy of Sciences, Beijing, China
Zijie Cheng
University of Chinese Academy of Sciences, Beijing, China
Yuxing Dou
State Key Laboratory of Mathematical Science, Academy of Mathematics and Systems Science, Chinese Academy of Sciences,
Beijing, China
University of Chinese Academy of Sciences, Beijing, China
Mun Sing Ho
Harvard China Project on Energy, Economy and Environment, School of Engineering and Applied Sciences, Harvard University,
MA, USA
Geoffrey J.D. Hewings
University of Illinois at Urbana-Champaign, IL, USA
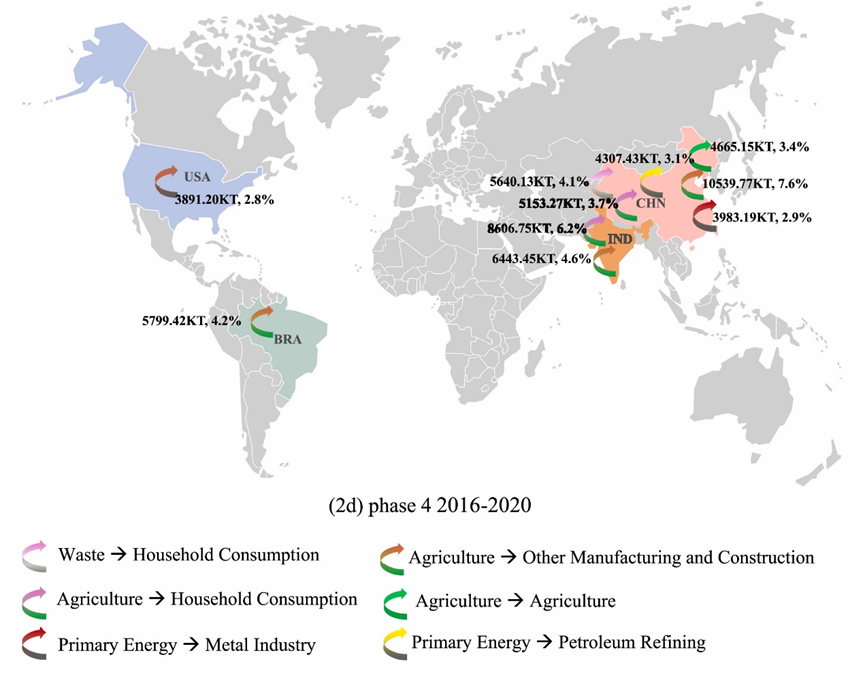
Fig. 2. The top 10 linkages by DOE (unit: kt) in key pathways across 4 phases.
Note: In this figure, bar colors correspond to sectors as indicated in the legend. The numbers and percentages on each bar denote the DOE of the linkage and its share of the total DOE in the key pathways for that phase.
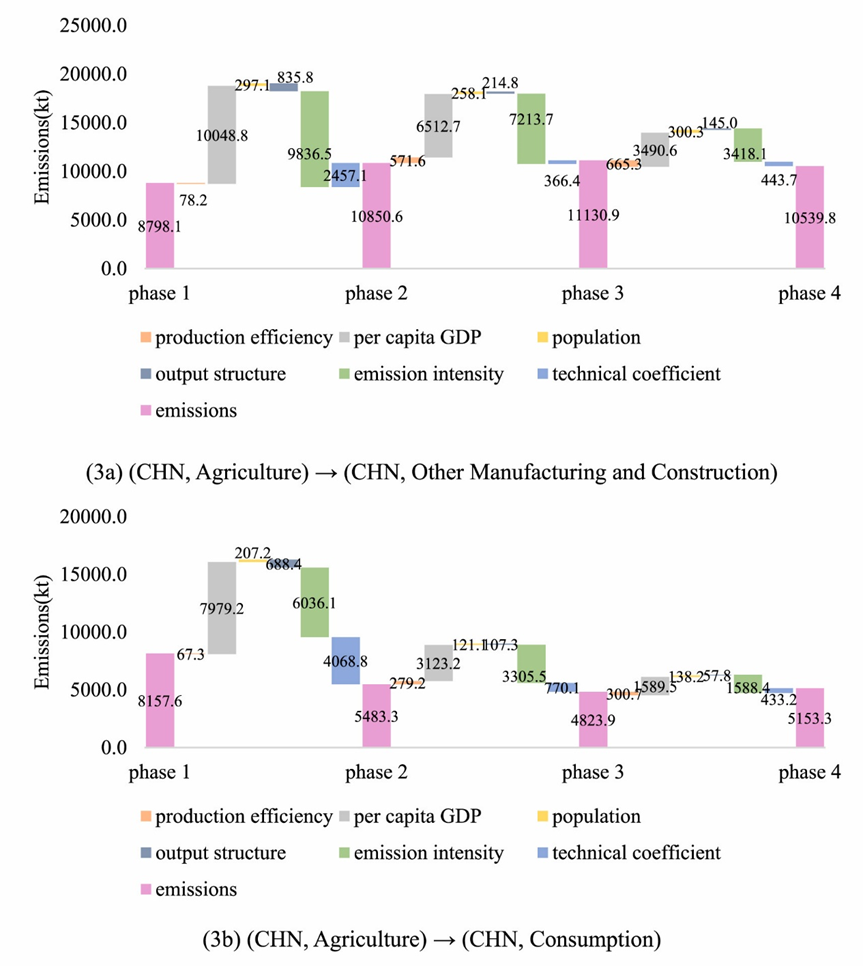
Fig. 3. Structural decomposition analysis of 6 impacting factors for DOE reduction in top linkages across 4 phases.
Note: In this figure, the number on each pink column indicates the DOE of the linkage for each phase as specified in the subtitle, while the numbers between columns denote the contributions of six impacting factors to the reduction in the DOE between consecutive phases.
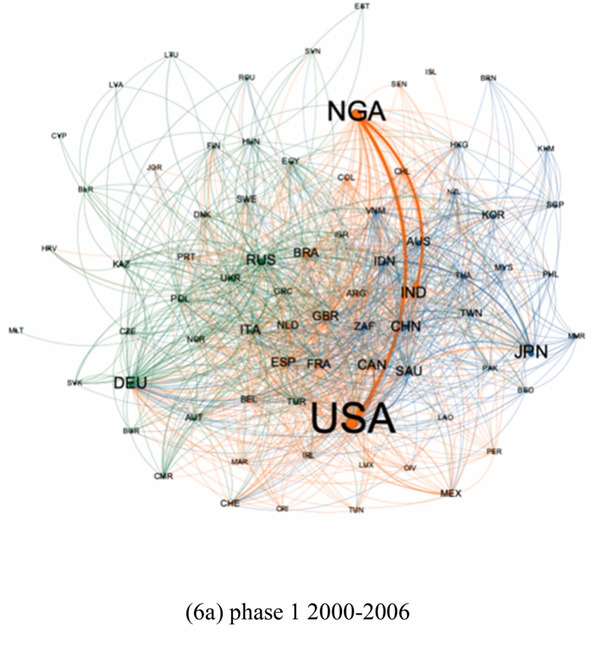
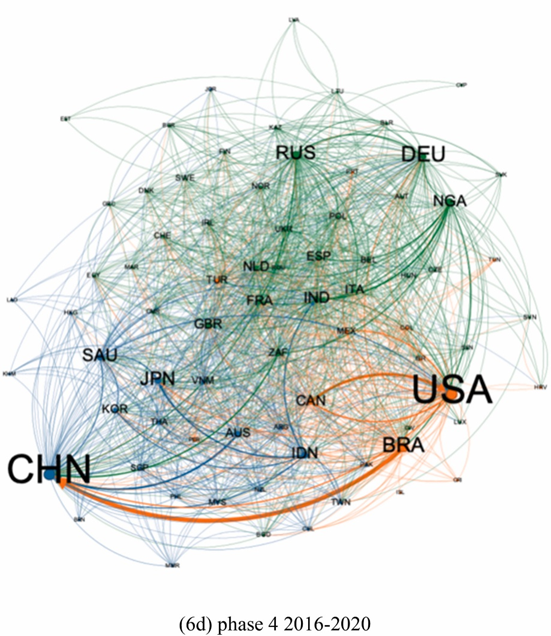
Fig. 6. Networks combined by key pathways of IME among economies by phase.
Note: In this figure, the thickness of lines between economies r and s indicates the IME volume in key pathways from r to s. Node size reflects the IME scale within each economy, and text size corresponds to the economy's network significance as determined by Page Rank. Colors of linkages from r to s match the color of r, reflecting the origin of goods sold as intermediate or final products from r to s.
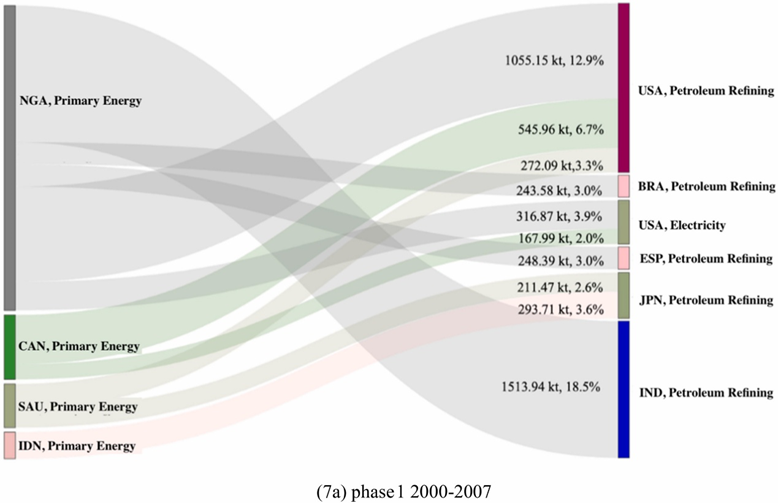
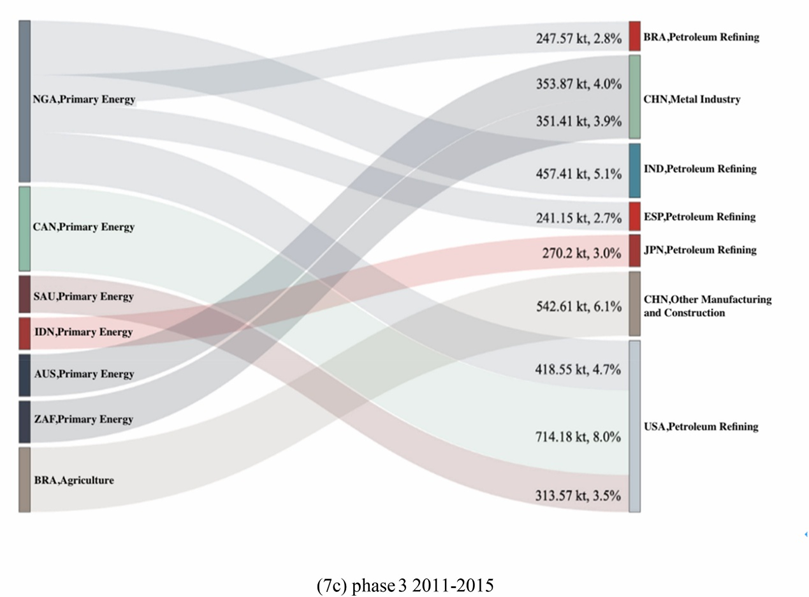
Fig. 7. Top 10 linkages by IME (unit: kt) in the key pathways across 4 phases.
Note: In this figure, the numbers and percentages on each flow denote the IME of the linkage and its share of the total IME in the key pathways for that phase.
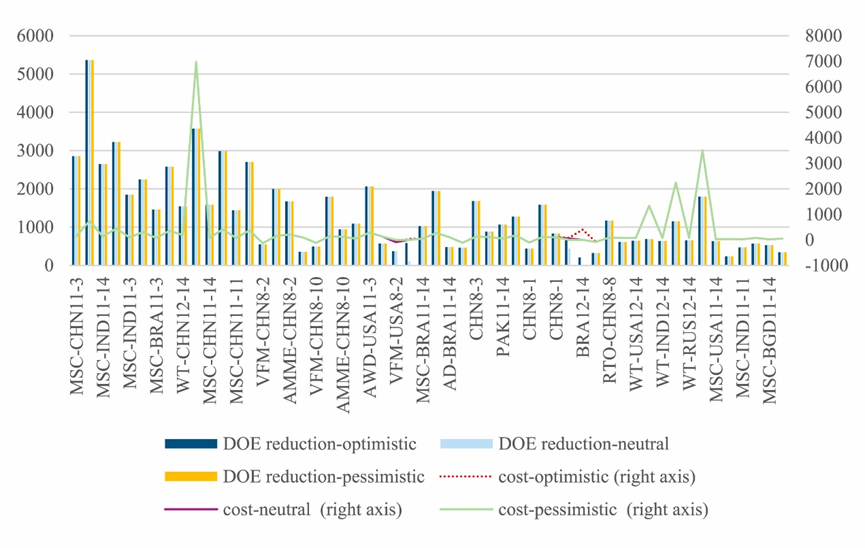
Fig. 9. Feasible technologies, DOE reduction (unit: kt), and costs (unit: million $) for DOE-based key linkages in scenario 1 in three cases.
Note: In this figure, MSC-CHN 11-3 denotes the key linkage from Sector 11 to Sector 3 in China is matched with MSC (Manure Storage Covers) technology. All other symbols on the x-axis follow the same naming rule. The full definitions of feasible technologies' abbreviations (e.g., MSC, WT) are provided in Table 2.
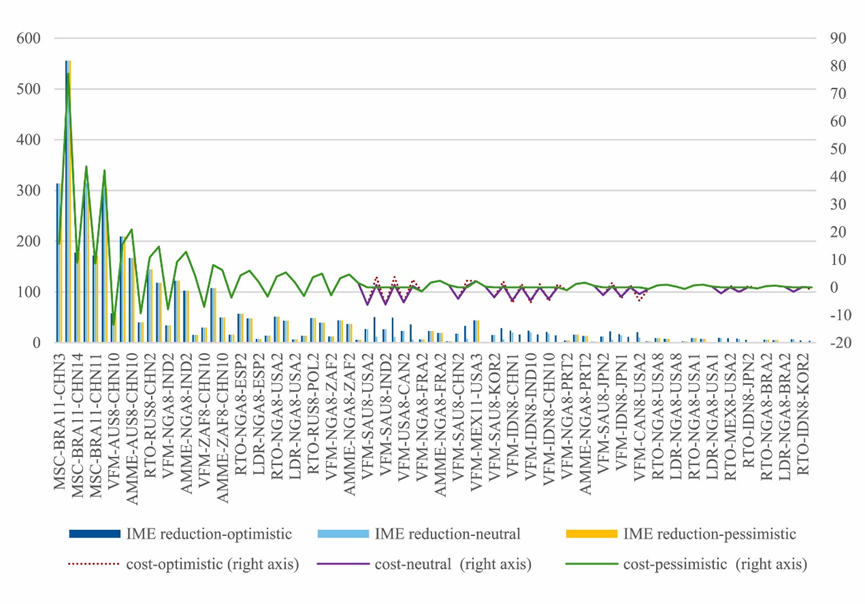
Fig. 10. Feasible technologies, IME reduction (unit: kt), and costs (unit: million $) for IME-based key linkages in scenario 1 in three cases.
Note: In this figure, MSC-BRA11-CHN3 denotes the key linkage from Sector 11 in Brazil to Sector 3 in China is matched with MSC (Manure Storage Covers) technology. All other symbols on the x-axis follow the same naming rule